The stats that show this is New Zealand’s chance to win in Australia

STATS PREVIEW FOR 1ST TEST
New Zealand comes to Australia for the 2015-16 series, boasting an excellent record in the past two years. Since October 2013, they have played 15 Tests, winning 9, drawing 3 and losing just 3.
During that period they have been unbeaten at home in 7 Tests (last Test lost at home was in 2012 to South Africa) and won Tests in West Indies (2), Pakistan (in UAE) and England. Reflecting on their previous ‘best’ era between Jan 1984 and March 1987, where in 28 Tests, they won 10, lost 6 and drew 12.
Here’s the table of results for the last two years, with Australia and New Zealand leading the way in terms of percentage of Tests won.
Team Tests Won Win % Lost Drawn
Australia 21 13 61 6 2
New Zealand 15 9 60 3 3
Pakistan 17 8 47 5 4
South Africa 13 6 46 2 5
Sri Lanka 21 9 42 8 4
England 24 8 33 12 4
India 19 5 26 8 6
Bangladesh 12 3 25 4 5
West Indies 20 4 20 13 3
Zimbabwe 4 0 0 4 0
In their strong patch in the 1980s, the Kiwis could boast a world champion bowler in Richard Hadlee, with batsman Martin Crowe perhaps the only other player of world class. Now they have a number of players that could make a World XI. Starting with their batting, they have some very strong numbers in the last two years
T Runs HS Avge 100 50
Kane Williamson 14 1564 242* 68.0 6 5
Brendon McCullum 15 1495 302 57.5 5 1
Ross Taylor 14 1130 217* 53.8 4 3
BJ Watling 15 1002 142* 47.7 3 5
Tom Latham 11 830 137 39.5 2 5
Jimmy Neesham 8 606 137* 43.2 2 3
** All up 22 centuries in the last 15 Tests
To win Test matches you generally need to take 20 wickets. And as you can see below Trent Boult has had a lot to do with the fact NZ have managed to do it 11 times in the last 15 Tests.
T Wkts Avge Best 5wI 10wM
Trent Boult 15 71 24.4 6-40 2 1
Tim Southee 15 61 27.9 4-19 0 0
Mark Craig 10 38 40.0 7-94 1 1
Neil Wagner 7 27 32.7 4-92 0 0
* Boult has actually played in the last 29 Tests for NZ, taking 115 wickets at 26.66.
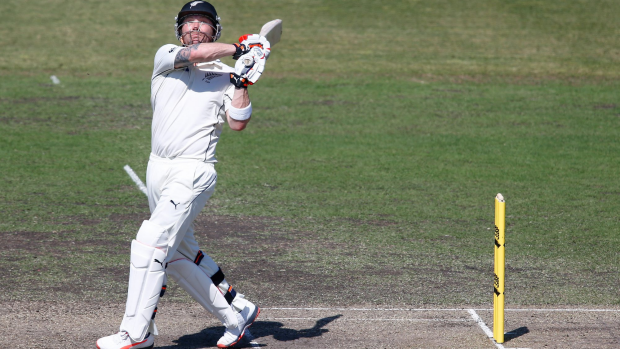
Looking at consecutive Tests played, resilient skipper Brendon McCullum has played the last 94 in a row for NZ, and hasn’t missed a Test since making his debut back in March 2014. The next best for his country is 58 by John Reid who played in the 1950s and 60s.
If he manages to play all 3 Tests in Australia, he’ll move into the top two in the history of Test Cricket, with AB de Villiers is about to commence a four-Test series in India.
AB deVilliers SA 98 17 Dec 2004 to 6 Jan 2015
AC Gilchrist Aus 96 5 Nov 1999 to 28 Jan 2008
BB McCullum NZ 94 10 Mar 2004 to 2 June 2015
RS Dravid Ind 94 20 Jun 1996 to 14 Dec 2015
SR Tendulkar Ind 84 15 Nov 1989 to 18 June 2001
Since October 2013, homeside Australia have played in 21 Tests, winning 13, losing 6 and drawing 2
The batting has been dominated by three main batsmen, as per below
T Runs HS Avge 100 50
Steve Smith 21 2330 215 70.6 10 7
David Warner 21 2248 145 56.2 9 11
Chris Rogers 19 1629 173 45.2 4 12
Michael Clarke 18 987 161* 34.0 4 0
Brad Haddin 17 752 118 30.0 1 6
Shane Watson 13 733 103 31.8 1 4
While with the ball, Mitchell Johnson has led the way, playing 20 of the 21 Tests having only missed the 4th Test v India at the SCG in January
T Wkts Avge Best Economy
Mitchell Johnson 20 101 21.8 7-40 3.14
Nathan Lyon 21 77 35.0 7-152 3.28
Ryan Harris 11 42 25.6 5-25 2.64
Josh Hazlewood 9 40 21.7 5-38 2.96
Mitchell Starc 10 37 29.8 6-111 3.48
Peter Siddle 11 31 33.9 4-35 2.72
Without Chris Rogers and Michael Clarke, their replacements are going to have big shoes to fill. As we saw in England, Ryan Harris was sorely missed for his accuracy and ability to restrict the scoring. With Mitchell Starc in superb early season form, he may pick up the slack if the aging Mitchell Johnson struggles to perform at the level above.
Looking at the numbers it really looks as though it will be a tight series.
I don’t care to make a prediction, but based on the stats above, I believe New Zealand has its best chance to record a series win in Australia, since 1985-86.


